
Clarify leaf collection details.
The schedule post drew 184 clicks, while 18 Agent questions lacked answers. Add missed-pickup and late-setout rules, then share a reminder.
184 link clicks · 18 unanswered questionsMONTHLY COMMUNITY REPORTING
Your updates. Your community’s response. Your next step. Bring the month together in a report your mayor and board can actually use.
A clear monthly view. A useful conversation.
FROM NUMBERS TO UNDERSTANDING
Follow one village’s updates, resident questions, and priorities. See how a few useful numbers become a clearer next step.
 Village of Maple GlenIllinois · October 2026
Fictional village. All figures are simulated. September comparisons are included where available.
30 distinct local updates became 90 publications across four channels in this sample.
| Channel | Publications | Content views | Interactions | Link clicks |
|---|---|---|---|---|
| 30 | 18,600 | 824 | 486 | |
| 28 | 9,800 | 424 | 154 | |
| Nextdoor | 24 | Unavailable | Unavailable | Unavailable |
| Google Business Profile | 8 | Unavailable | Unavailable | Unavailable |
Views can include repeat viewing and are not unique residents. Measured views, interactions and clicks in this sample cover Facebook and Instagram only. Monthly totals are not adjusted for the different number of days.
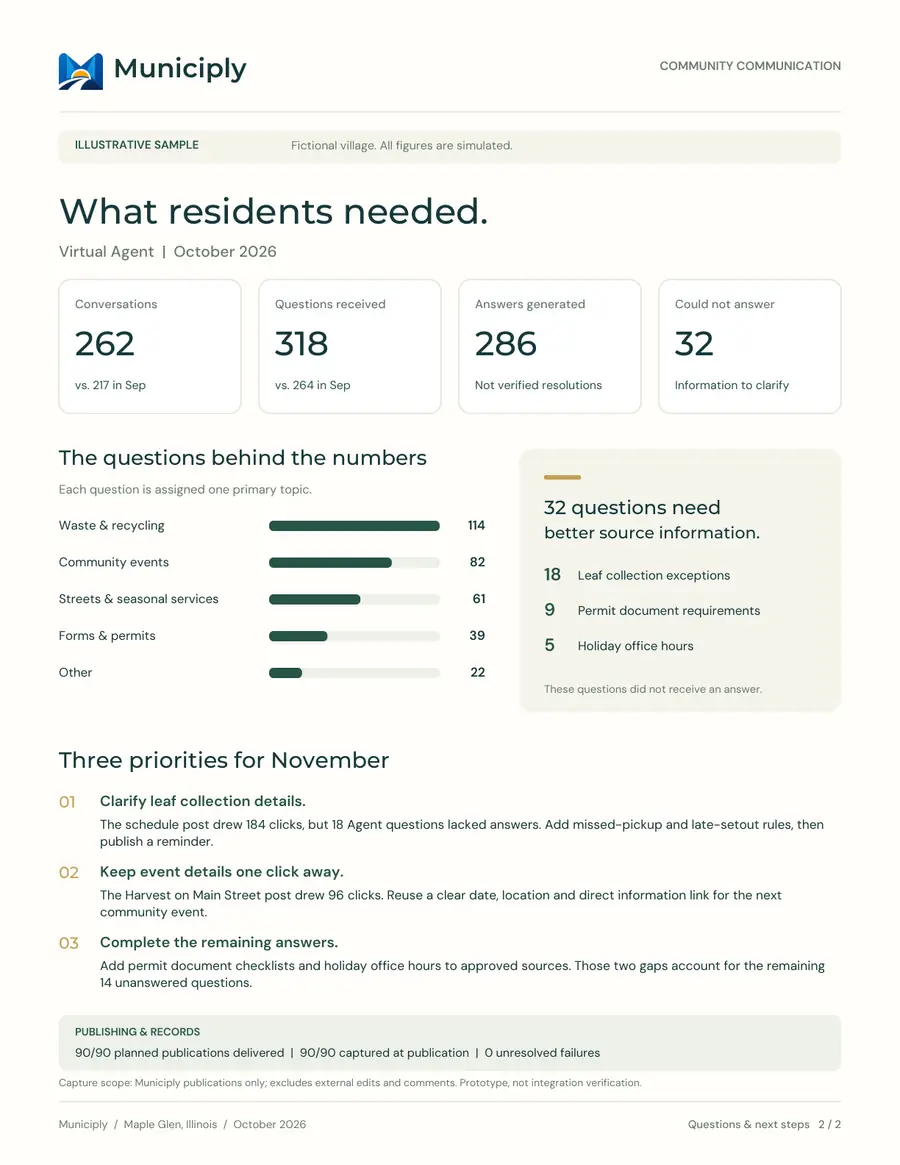
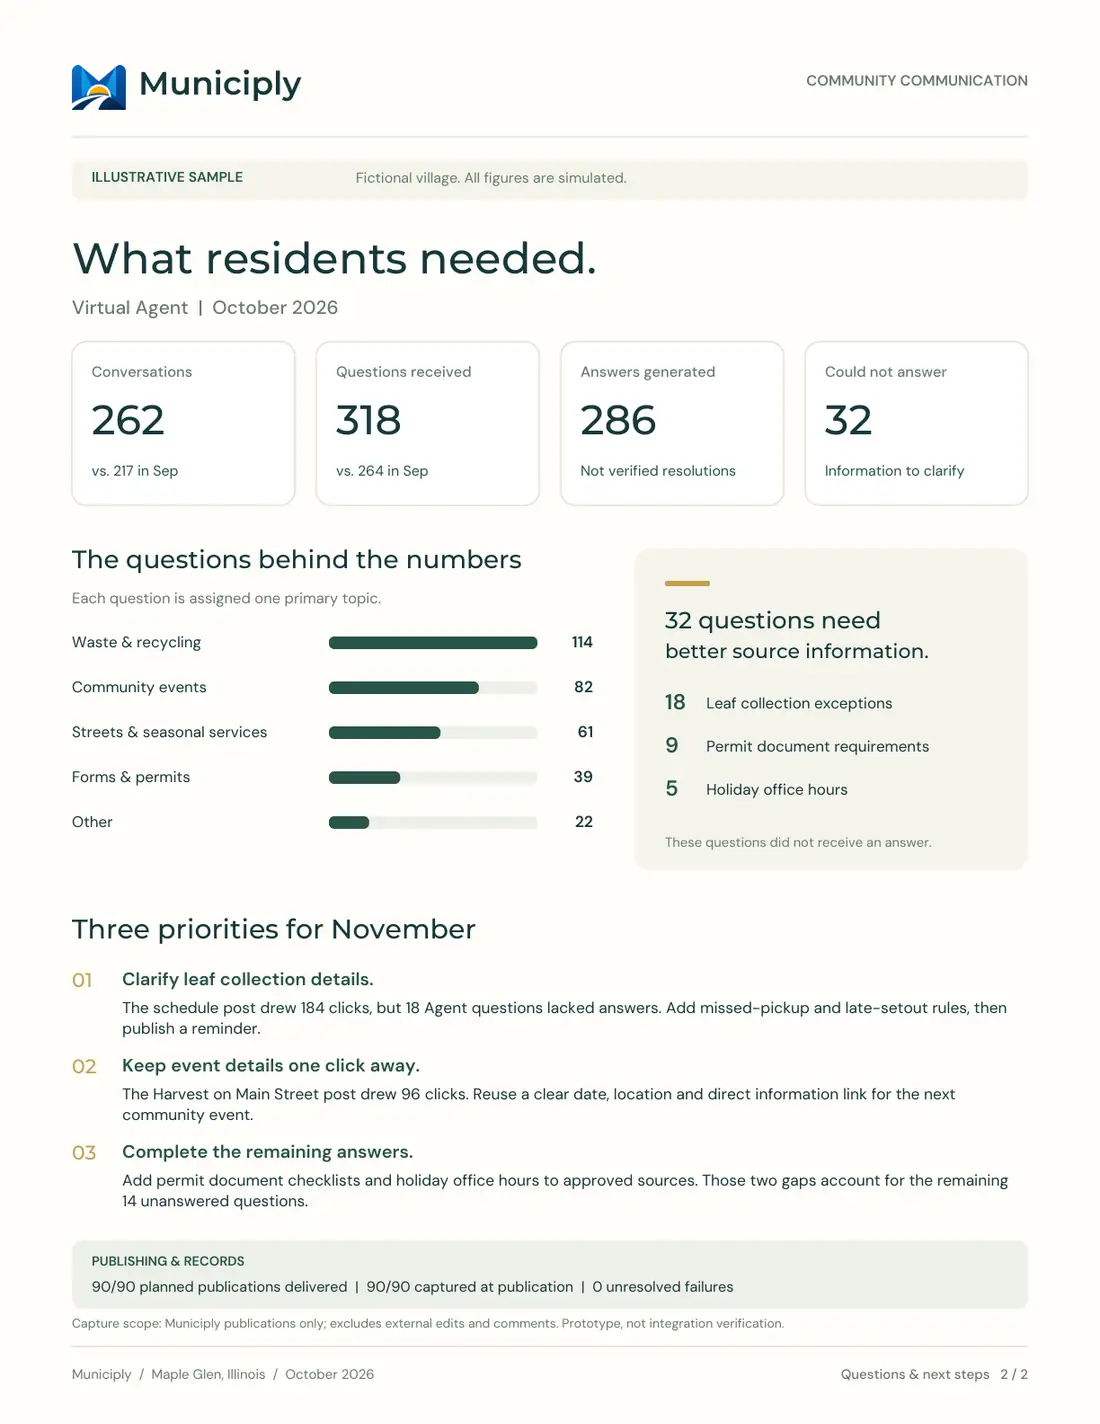
Virtual Agent questions reveal the everyday information residents are trying to find.
The sample contains 286 generated answers. An answer generated is not a verified resolution. Agent reporting applies when that service and its activity data are available.
The report gives the team a starting point for its next planning conversation.
The schedule post drew 184 clicks, while 18 Agent questions lacked answers. Add missed-pickup and late-setout rules, then share a reminder.
184 link clicks · 18 unanswered questionsHarvest on Main Street drew 96 clicks. Give the next event the same clear date, location, and direct link to village information.
96 clicks to event informationAdd permit document checklists and holiday office hours to approved sources. Those topics account for the other 14 unanswered questions.
9 permit questions · 5 office-hours questionsIllustrative findings from the sample PDF. Clicks show interest in information; they do not prove event attendance, completed applications, or service outcomes.
This sample illustrates the reporting format, including channels Municiply does not publish to yet. Today that is Facebook; Instagram is in development, and Google Business Profile and Nextdoor are planned. Live measures depend on connected channels and available data. See current availability ↗
FOR THE PEOPLE MAKING DECISIONS
Give the clerk, mayor, and board a shared view of the work. A concise monthly report makes room for the conversation that follows.
Give the numbers a clear reporting period and compare completed months when the data allows.
See the channels, topics, and information gaps behind the totals.
Use a printable monthly view for your board packet and planning conversation.
WHAT A USEFUL REPORT CAN SHOW
Available information, organized around the questions a municipal team actually asks.
Distinct local updates, publications by channel, and publishing status.
Available views, reactions, comments, shares, and saves—with the channel attached.
Measured clicks to schedules, event details, forms, and useful local information.
Follower changes by channel, where the connected platform supplies them.
Agent conversations, common topics, and questions that need better source information.
A short set of findings that helps your team decide what to clarify or share next.
Clear about what the numbers mean. Missing data is shown as unavailable. Repeat views are not unique residents. Generated answers are not verified resolutions.
A FEW GOOD QUESTIONS
Yes. The two-page Maple Glen PDF is included on this page. Maple Glen, Illinois is fictional and every figure is simulated. It shows the proposed report format, not results from a real customer.
Download sample PDF ↗No. Platforms supply different data and require their own supported connections. Reports should make that coverage visible. Unavailable information is shown as unavailable, rather than being treated as zero.
The social reporting story stands on its own. Resident-question reporting applies when the Virtual Agent is part of your setup and its activity data is available.
Platform views and reach have different definitions. One person can view several updates or use more than one network. The report keeps those measures in context and does not label a combined total as unique residents reached.
The monthly report has a printable view. Your team can print it or save that view as a PDF for a board packet. The sample download shows the intended two-page presentation; confirm the current report layout and available measures during a demo.
YOUR TEAM. YOUR WORK. YOUR COMMUNITY.
Bring one busy month. We’ll walk through the reporting view
and the information available for your community.